Investboard …
Three portfolio examples show how to uncover the stocks you own through ETFs, measure overlap and see each holding as a share of your whole portfolio. Three prompts to see what you own directly and through your ETFs.
In a sample portfolio, an 80% allocation to the iShares Core MSCI World UCITS ETF added 4.62 percentage points to a 10% direct Apple position. Total Apple exposure was 14.62%. ETF look-through shows that combined weight by multiplying the allocation to each fund by Apple’s weight inside it, then adding any Apple shares held directly.
The 80% world ETF allocation adds 4.62 percentage points of Apple exposure.
Cash stays in the denominator when holdings are shown as a share of the whole portfolio.
The world and S&P 500 ETFs in the sample had 70.5% holdings overlap.
The card opens with three holdings and expands to the requested list, up to 20.
In a sample portfolio, an 80% allocation to the iShares Core MSCI World UCITS ETF added 4.62 percentage points to a 10% direct Apple position. Total Apple exposure was 14.62%. ETF look-through shows that combined weight by multiplying the allocation to each fund by Apple’s weight inside it, then adding any Apple shares held directly.
The 80% world ETF allocation adds 4.62 percentage points of Apple exposure.
Cash stays in the denominator when holdings are shown as a share of the whole portfolio.
The world and S&P 500 ETFs in the sample had 70.5% holdings overlap.
The card opens with three holdings and expands to the requested list, up to 20.
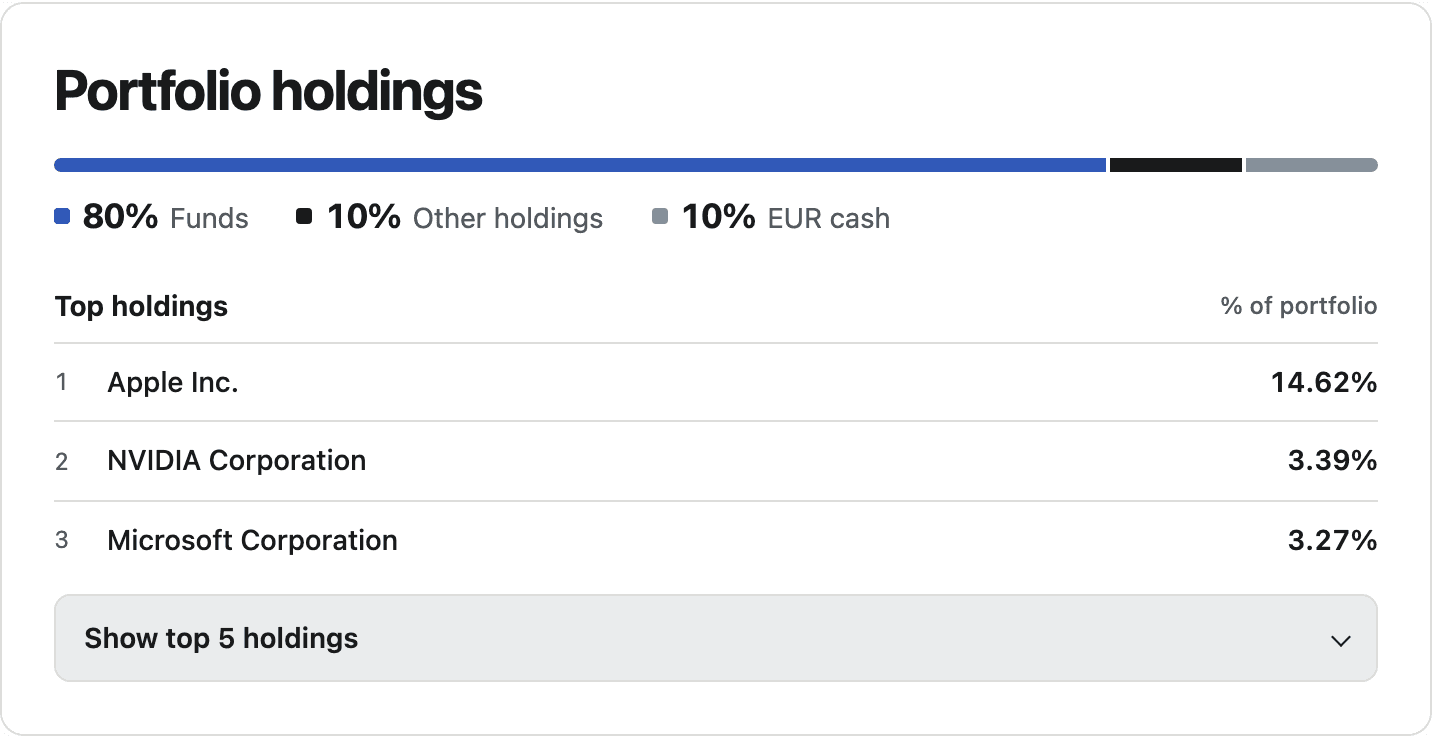
A sample portfolio started with 10% in Apple stock. It also held 80% in the iShares Core MSCI World UCITS ETF and 10% in EUR cash. Apple made up about 5.78% of the ETF, so that fund added 4.62 percentage points of Apple exposure. Looking through the ETF brought the total to 14.62%.
That calculation is called ETF look-through. It weights each company inside a fund by the share of your portfolio invested in that fund. When you own the same stock directly or through multiple funds, Investboard adds those exposures together.
Use Investboard to analyze a sample portfolio with 80% iShares Core MSCI World UCITS ETF (IE00B4L5Y983), 10% Apple stock (US0378331005), and 10% EUR cash. Show my total Apple exposure, including the ETF, and return just the five largest holdings.
The ETF contribution works out to 80% × 5.78% ≈ 4.62% of the whole portfolio. Add the 10% direct position and you get 14.62%. Apple ranks first, followed by NVIDIA at 3.39% and Microsoft at 3.27%. Because the prompt asks for five holdings, the card opens with three and expands to five.
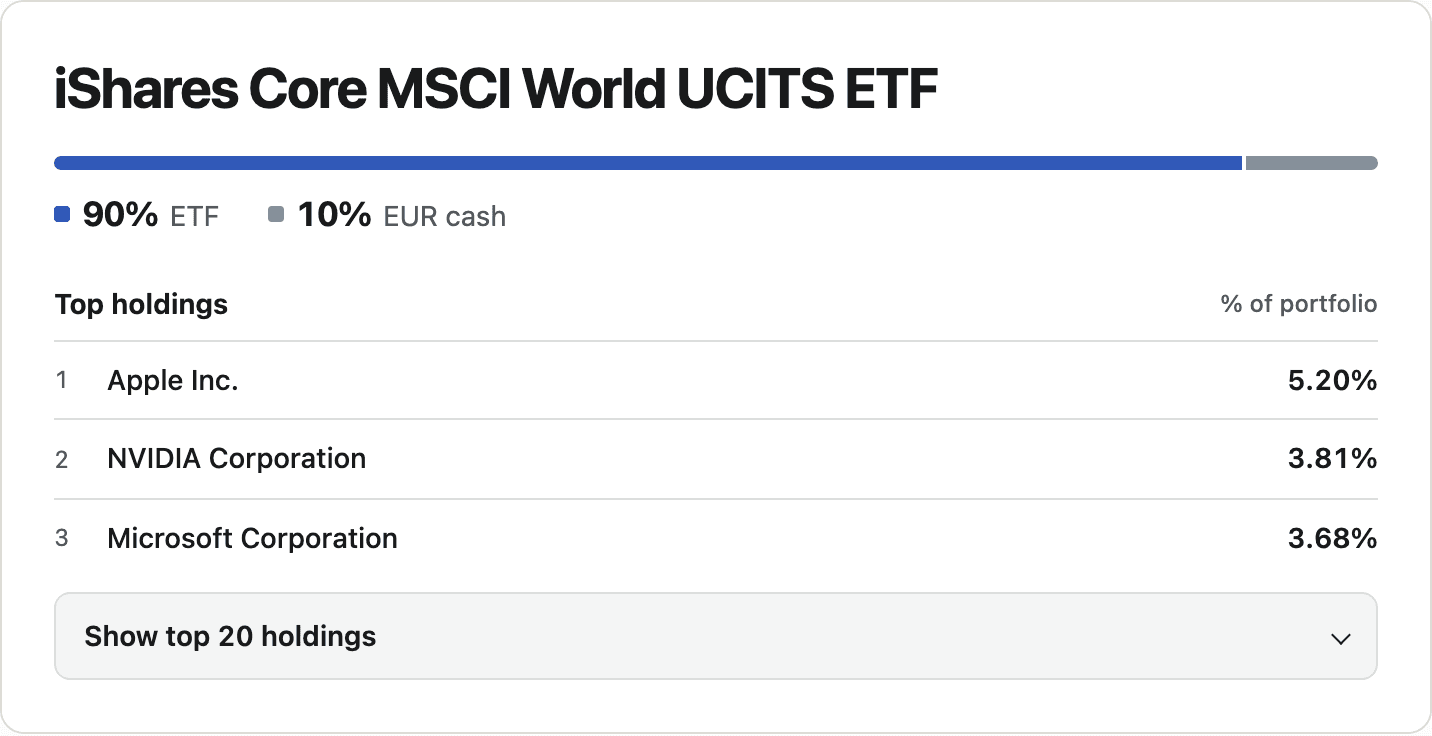
Use Investboard to look through a sample portfolio of 90% iShares Core MSCI World UCITS ETF (IE00B4L5Y983) and 10% EUR cash. Show the largest holdings as a share of the whole portfolio.
Here, all the Apple exposure comes through the ETF. Its roughly 5.78% weight in the fund contributes 5.20% of the whole portfolio. NVIDIA follows at 3.81% and Microsoft at 3.68%. Including cash in the denominator is what makes the figures comparable with the first example.
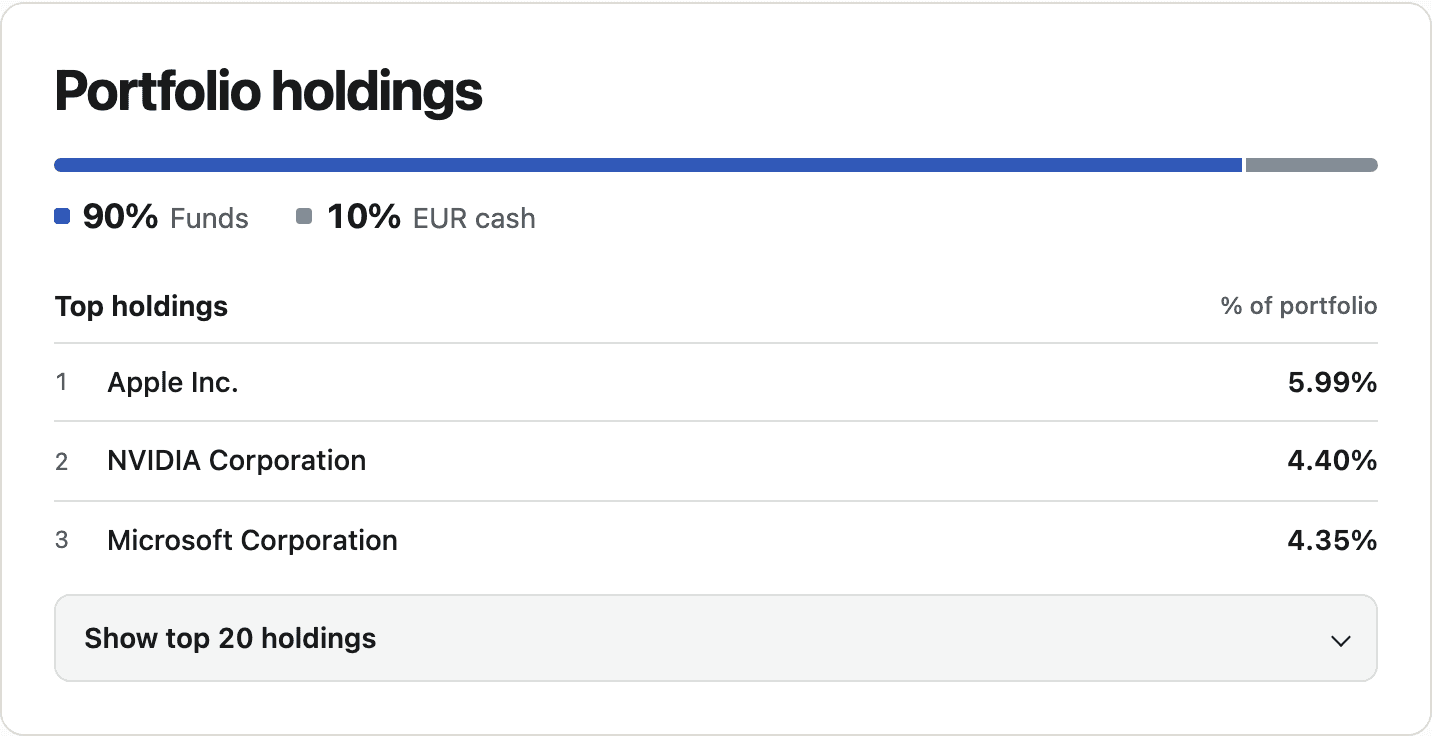
Use Investboard to analyze a sample portfolio with 55% iShares Core MSCI World UCITS ETF (IE00B4L5Y983), 35% iShares Core S&P 500 UCITS ETF (IE00B5BMR087), and 10% EUR cash. Show the biggest combined exposures and check whether the funds overlap.
The two funds had 70.5% holdings overlap. Investboard calculates that by taking the smaller fund weight for each security the two funds share and adding those weights. Apple accounted for 5.99% of the whole portfolio after combining its exposure from both ETFs. The overlap compares the two funds, while the card weights each holding against the portfolio, including cash.
Start with the securities you want to analyze and their portfolio weights. Give Investboard the ETF ISINs, any directly held stocks and the cash currency. Ask for the results as percentages of the whole portfolio and say how many holdings you want to see.
For help getting set up, explore the Investboard AI Toolkit or read the ChatGPT portfolio analysis guide.
The holdings tool supplies the calculated weights and the card displays them beside the answer. For the wider workflow behind connected data and tools, read Your AI investing workflow needs more than a chatbot.
We ran the three sample portfolios against Investboard’s staging MCP on November 18, 2026. Each reconciled to 100% using the unrounded weights. The images show the cards served by staging and rendered in a browser.
Choose your AI agent and follow its installation steps for the four skills or an MCP connection. Start free with files you provide. Account access requires separate authorization; portfolio analytics and saved history require Premium.