Investboard research · First public edition · October 8, 2026
Weather the Storm
Pursue growth. Depend less on the AI boom.
An equity-majority portfolio with 30 holdings and six asset groups. Inspect the ownership, challenge the backtest and follow the decision into Investboard.
A portfolio selected with hindsight. The historical result is evidence to examine, not a forecast.
David Bartas / Investboard
In short
Weather the Storm is a hypothetical 30-holding allocation with 54% equities and 46% in bonds, gold, commodity futures, managed futures and Treasury bills. Its first public edition compares actual fund histories over 2021–2025. The report measures technology, semiconductor and AI exposure, including overlapping holdings inside funds.
01.
Each position targets 3% or 4%, with a 5% rule applied after modeled daily-close rebalancing.
02.
The holdings were selected with hindsight; the chart covers actual fund histories in 2021–2025.
03.
Looking through the funds reveals overlapping companies and shared economic exposures.
04.
The full report documents every holding, its intended role, risks and the simulation assumptions.
The storm behind the name
AI can become indispensable while investors earn disappointing returns. Competition, overbuilding, depreciation and the purchase price determine how much of that progress reaches shareholders. Our companion essay, Is this time different?, explores that gap.
Storm keeps a limited stake in AI and other growth businesses while allocating capital to different economic drivers. It can participate if AI investment succeeds; its construction does not require a crash.
Diversify the economic drivers
Ray Dalio’s diversification argument is useful because it asks what makes investments behave differently. Bridgewater’s All Weather framework organizes exposures around surprises in growth and inflation. Geographically broad equity funds can still share exposure to the same earnings cycle, interest rates and technology valuations.
Our allocation applies that question to a portfolio with a 54% equity majority. It assigns target capital weights across asset classes; Bridgewater’s institutional approach instead seeks to balance risk contributions.
All return comparisons include price changes and reinvested distributions. Gold contributes through its price; other holdings can also distribute income.
The allocation and its rules
Allocation
Target
Intended role
Equities
54%
Growth, with several industries and regions
Bonds
20%
Nominal Treasuries and inflation-linked bonds across maturities
Gold
8%
A different response to monetary and confidence shocks
Commodities
7%
Broad commodities and agriculture
Managed futures
7%
Two related strategies with changing long and short futures exposure
Treasury bills
4%
Short-duration liquidity
Each holding targets either 3% or 4%. The model resets the whole portfolio at completed quarter-ends and whenever a daily closing position exceeds 5%. Market moves can take a position above the limit before correction. In the simulation through September 29, 2026, the largest weight was 5.54% before correction and 4.99% afterward.
Managed futures: two processes, one related group.KMLM receives 3% for systematic long and short positions in commodity, currency and bond futures, without equity futures. FMF contributes another 4% through an active managed-futures strategy. Together they can respond to sustained trends in either direction, but reversals and directionless markets can cause losses. The funds are related: their weekly correlation was about 0.68 in 2021–2025.
Physical gold: two vehicles, one exposure.GLDM and IAU each receive 4%. The two instruments respect the position-size rule while expressing one 8% bullion allocation. GLDM’s stated annual expense ratio is 0.10%. Gold introduces a return mechanism independent of corporate earnings, but it still responds to real rates, currencies and investor demand.
Equities: several routes to earnings. Casella combines necessary waste services with acquisition-led growth; Lilly offers medical innovation; TGS adds Argentine energy infrastructure; and TPL adds land, royalties and water economics, with an acknowledged AI connection. NVIDIA and QQQ provide bounded participation in a successful AI future. These are intended business roles, not assurances that their share prices will move independently.
Inside Investboard · Storm research account
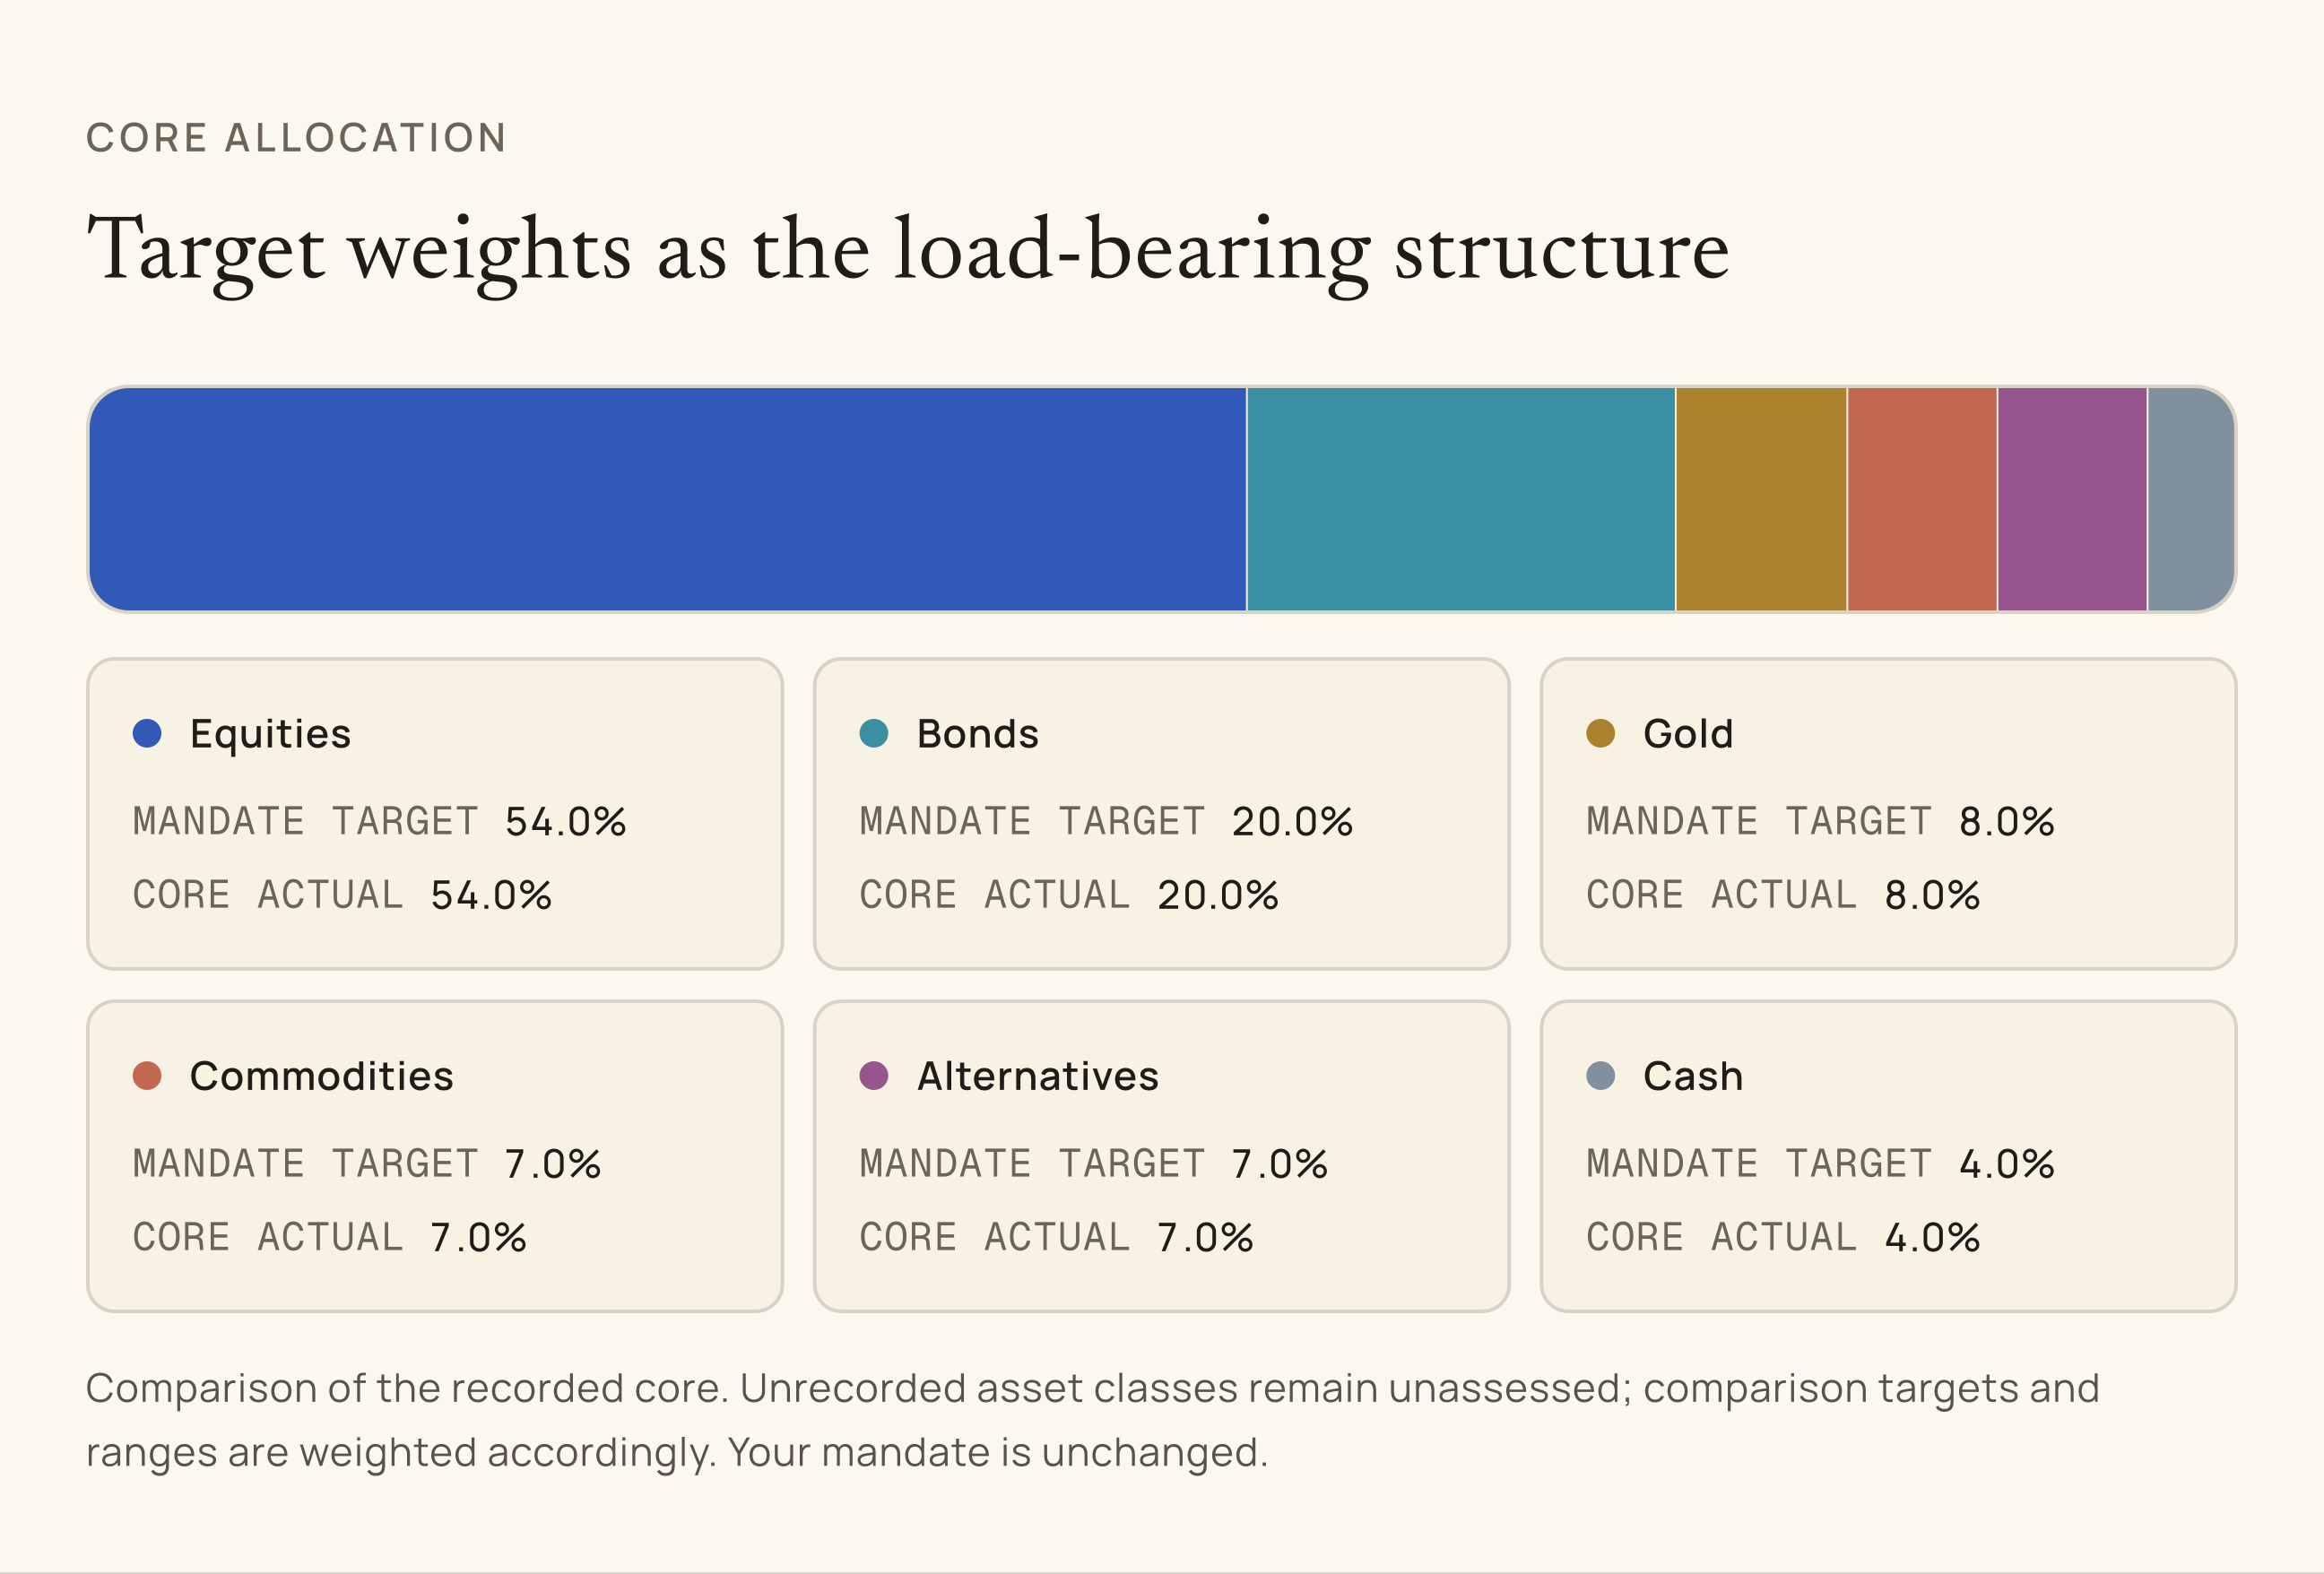
All six groups match their targets.
Synthetic USD 100,000 Storm account, October 9, 2026, at frozen prices. Alternatives = managed futures; cash = Treasury bills.
Inspect what each position contributes and where its rationale could fail. These are the report’s target weights, roles and risks.
Open an asset group to read every holding’s role and risk.
Equities54%+
SPY
3%
SPDR S&P 500 ETF
Broad US earnings.
SPY anchors the equity sleeve in broad US business earnings, reducing dependence on the thirteen selected stocks. Its small 3% allocation leaves room for other economies and return drivers while retaining participation if large US companies continue to compound. It supports the growth objective; the defensive work belongs to other holdings.
What can go wrong: It overlaps with QQQ and NVIDIA. A broad index can still be concentrated in expensive technology leaders and fall sharply in an equity sell-off.
QQQ
3%
Invesco QQQ Trust
Participation in innovation.
QQQ deliberately keeps a route into innovation, productivity and large growth businesses. Storm should still participate if the AI boom produces durable earnings and the feared crash never arrives. At 3%, this is a bounded growth allocation alongside the broad market, accepting some overlap to avoid making the whole portfolio depend on a bearish technology forecast.
What can go wrong: Technology valuations and discount rates can dominate returns. Overlap with SPY and direct NVIDIA increases the combined exposure beyond the visible ticker weights.
IWM
3%
iShares Russell 2000 ETF
Growth beyond the mega-caps.
IWM broadens the growth engine toward smaller US companies, whose fortunes depend more on domestic demand, financing and business recovery. It gives Storm a way to benefit when market leadership spreads beyond large technology companies. Its purpose is breadth within equities; it should not be expected to shelter the portfolio during a credit contraction.
What can go wrong: Small companies are sensitive to refinancing costs, weak balance sheets and recessions. They can fall alongside large companies in a market-wide sell-off.
VEA
3%
Vanguard FTSE Developed Markets ETF
A wider geographic base.
VEA brings developed-market earnings, currencies and sector leadership from outside the US. It reduces dependence on US valuations and policy while retaining the compounding potential of established businesses. This is a meaningful geographic complement to SPY and QQQ, particularly if the next period of equity leadership comes from markets that previously lagged.
What can go wrong: Currencies and overseas economic weakness can offset local-market gains. International stocks often remain correlated with US equities during global stress.
VWO
3%
Vanguard FTSE Emerging Markets ETF
Different development cycles.
VWO adds emerging-market development, local policy cycles and businesses outside the developed-market core. Different growth paths justify a modest allocation even when global equities remain correlated. It also brings Asian manufacturing exposure; a small capital weight does not remove Taiwan and China dependencies.
What can go wrong: Taiwan, China and semiconductor supply chains remain material dependencies. Policy, governance, currency and liquidity risks can arrive together.
VZ
3%
Verizon Communications Inc.
Recurring connectivity demand.
Verizon supplies recurring cash flows from connectivity, an essential service less directly tied to AI capital spending. Its intended role is a steadier business earnings stream within equities, with distributions reinvested. Network economics still require substantial investment, so reliable customer demand must translate into cash after financing and capital costs.
What can go wrong: Debt, network investment and price competition determine how much recurring revenue becomes shareholder return. A stable service does not guarantee a stable share price.
CWST
3%
Casella Waste Systems, Inc.
Essential services. Room to grow.
Casella combines recurring waste-service demand with a route to growth through local scale, pricing and acquisitions. Keeping it preserves the more ambitious compounding objective within a necessary-service business. The case for this position rests on everyday disposal economics and disciplined expansion, rather than technology investment or a promise that defensive demand makes the equity risk-free.
What can go wrong: Acquisition prices, integration, leverage and valuation can overwhelm resilient demand. Its smaller scale adds execution risk compared with larger waste operators.
DHT
3%
DHT Holdings, Inc.
A different freight cycle.
DHT earns from tanker freight, where vessel availability, trade routes and tonne-miles can matter more than technology earnings. That different cycle is the reason to own it: shipping scarcity can create strong cash generation while other businesses struggle. At 3%, it adds a distinct cyclical opportunity without making volatile freight distributions the portfolio’s foundation.
What can go wrong: Freight rates, fleet supply and oil demand can reverse abruptly. Earnings and dividends are highly cyclical; this is not dependable recession protection.
DRD
3%
DRDGOLD Limited
Operating leverage to gold.
DRDGOLD adds a growth business linked to the gap between gold prices and the cost of recovering metal from tailings. That operating leverage differs from both conventional growth stocks and physical bullion. The position can strengthen returns during favourable gold conditions, but its purpose is a distinct earnings opportunity; GLDM and IAU carry the simpler bullion role.
What can go wrong: South African operating conditions, power, currency, costs and execution add risks absent from bullion. A gold-price gain need not translate into an equity gain.
FCN
3%
FTI Consulting, Inc.
Demand when businesses change.
FTI Consulting earns from specialised advice, disputes, investigations and restructuring. Some demand can rise when companies face financial or operational stress, giving Storm a business whose opportunities need not depend on a buoyant investment cycle. It is a useful complement to growth and cyclical stocks, while the wider advisory franchise preserves ordinary business expansion potential.
What can go wrong: Not every segment benefits from distress. Transaction activity, client budgets, staff retention and utilisation affect profitability; the stock is not a crisis hedge.
LLY
3%
Eli Lilly and Company
Growth through medical innovation.
Eli Lilly provides a major innovation and growth engine outside the AI investment cycle. Successful medicines can expand earnings through clinical outcomes, manufacturing and patient adoption, giving Storm a different route to long-term compounding. This is deliberately more ambitious than a generic defensive healthcare allocation, and its 3% size recognises that promising products can already command demanding valuations.
What can go wrong: Concentration in major therapies, clinical setbacks, competition, reimbursement and pricing can disappoint expectations. Healthcare demand alone does not protect a high valuation.
NVDA
3%
NVIDIA Corporation
AI growth, counted across every route.
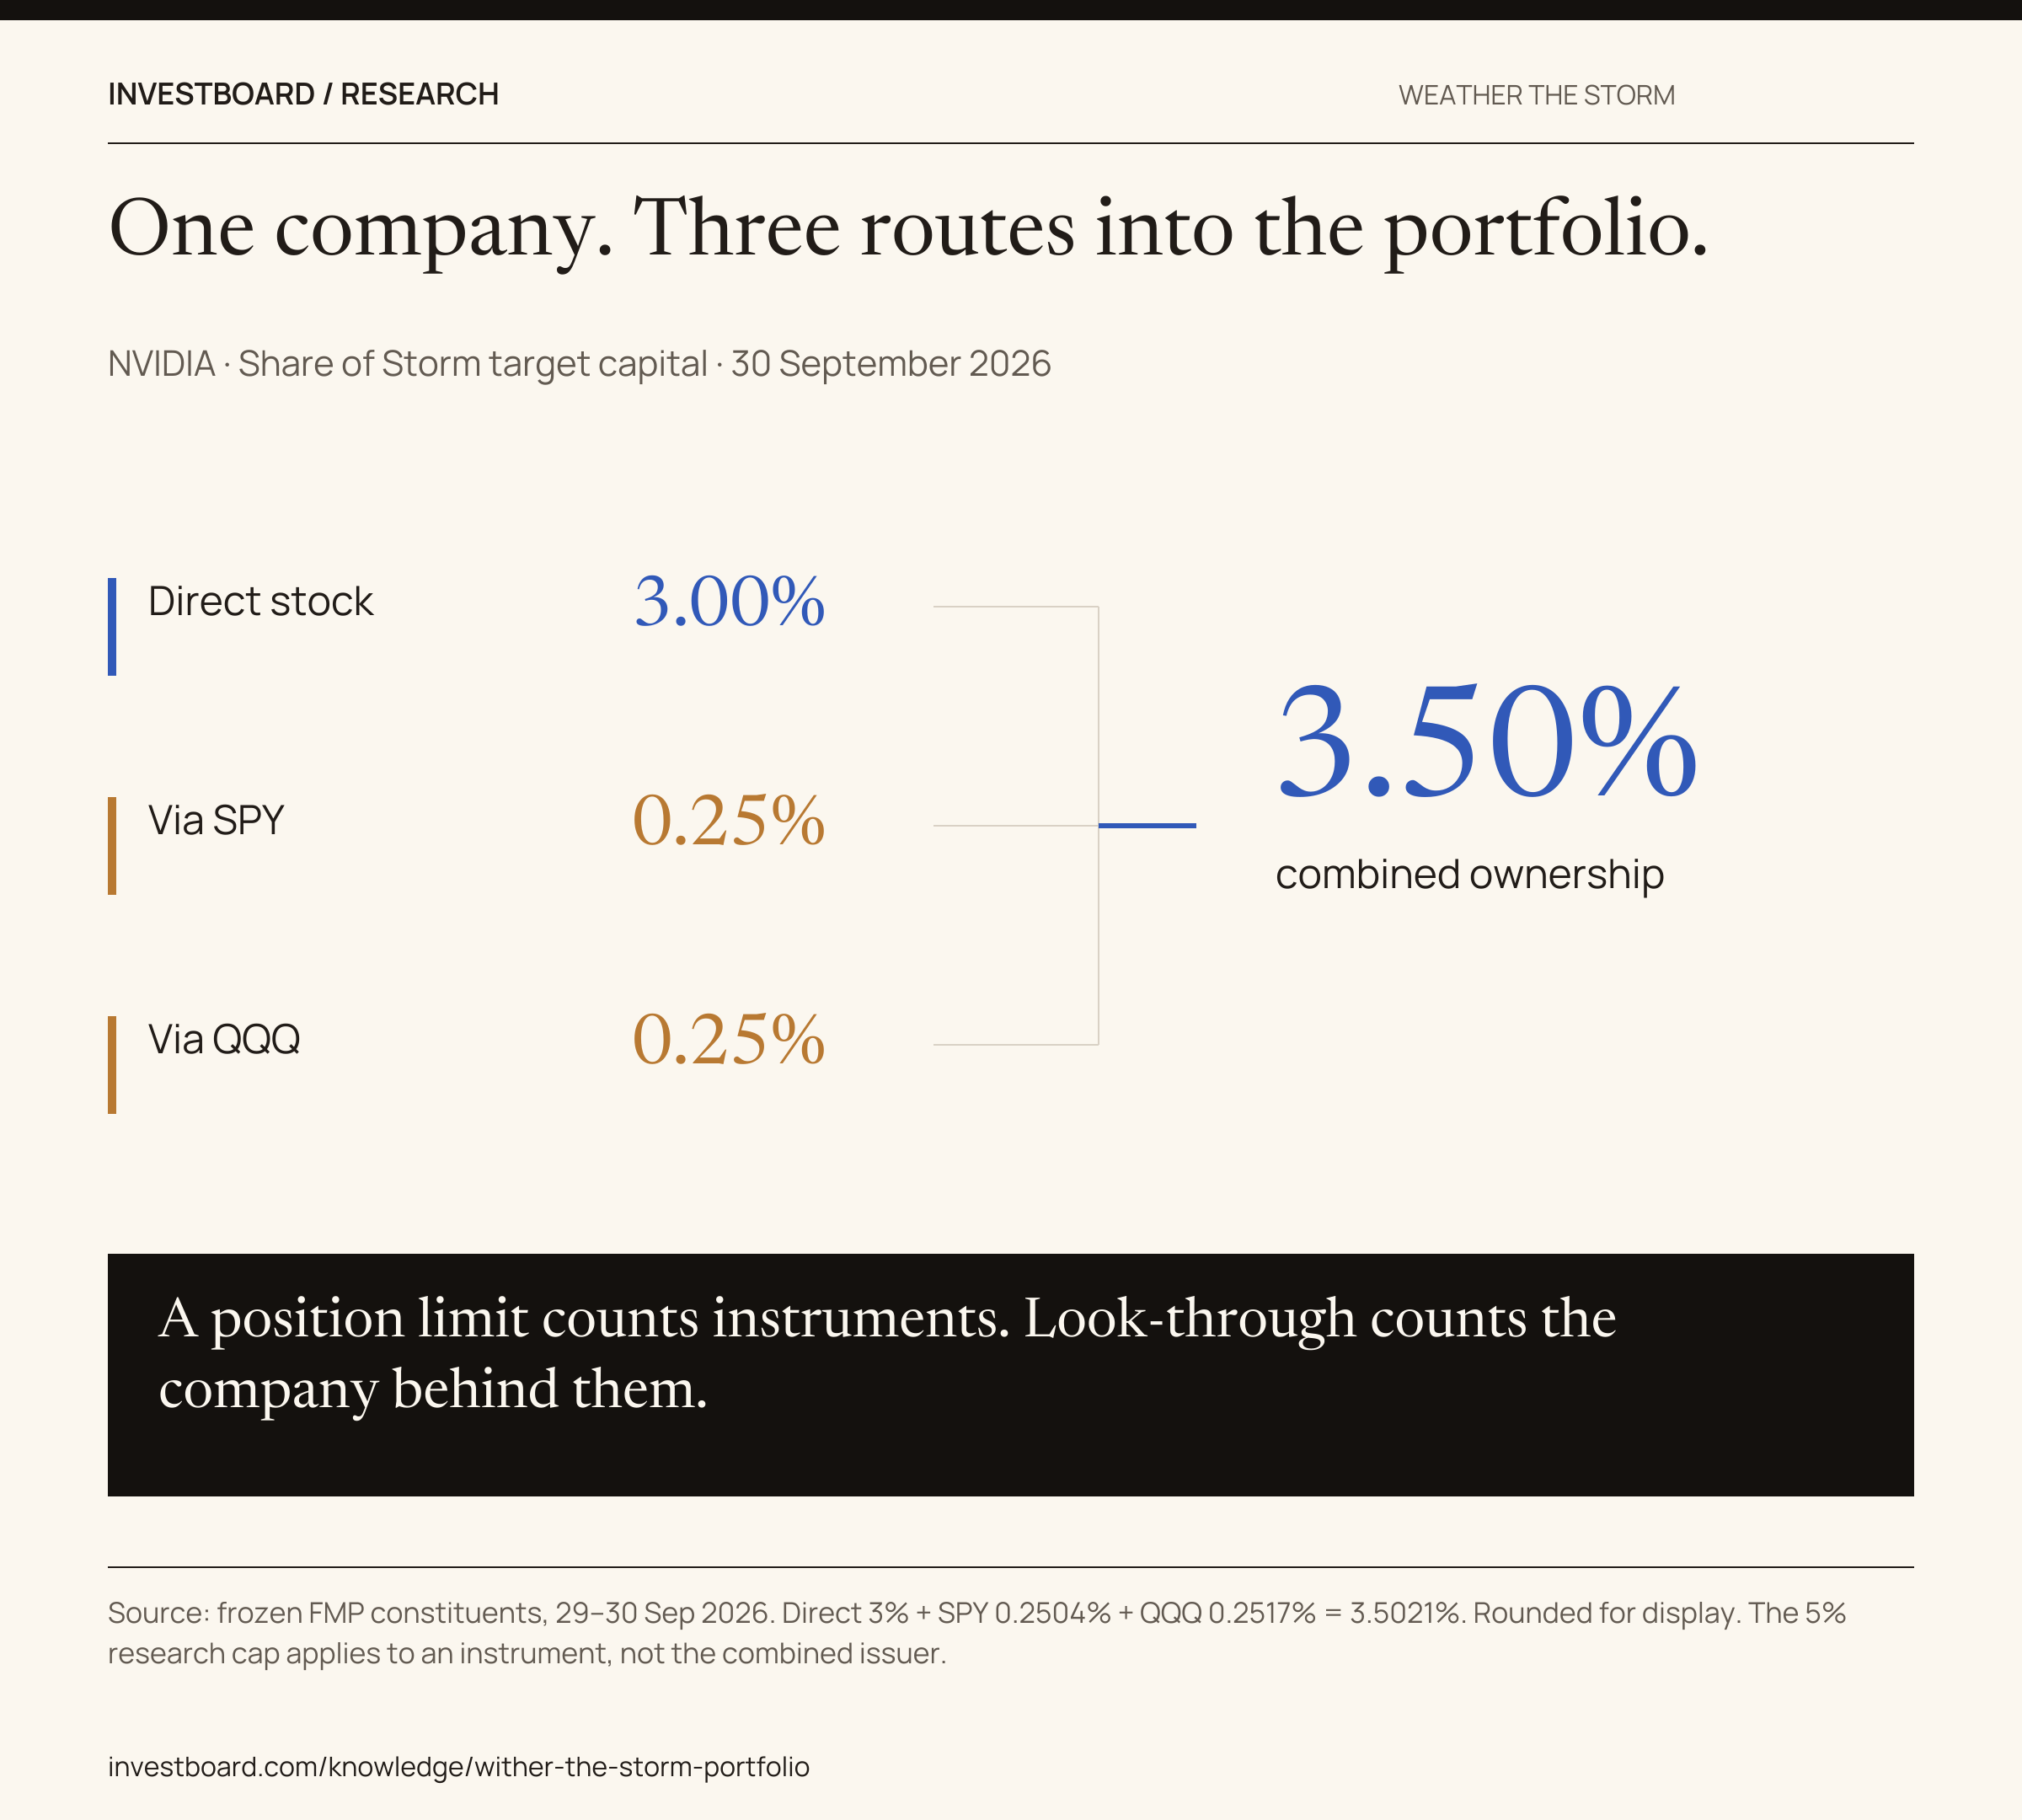
NVIDIA preserves direct participation in AI computing if investment converts into durable customer value and earnings. Keeping a bounded stake supports the ambition to outgrow the S&P 500 without requiring an AI crash to occur. Its role must be assessed across all routes: the 3% direct target becomes about 3.50% after SPY and QQQ are included.
What can go wrong: A spending slowdown, competing chips, export restrictions or valuation compression can hit sharply. Taiwan manufacturing dependencies and fund overlap amplify the economic exposure.
PGR
3%
The Progressive Corporation
Underwriting as an earnings engine.
Progressive adds underwriting economics: pricing risk, selecting customers, managing claims and investing premium income. Those decisions create an earnings cycle distinct from chip demand, freight rates or drug launches. The attraction is the potential to compound through disciplined insurance operations, giving the equity sleeve another business model rather than another version of the same growth theme.
What can go wrong: Claims inflation, catastrophes, pricing errors and regulation can weaken underwriting. Investment returns and equity valuation also matter; insurance is not automatically defensive.
TGS
3%
Transportadora de Gas del Sur S.A.
Energy infrastructure in Argentina.
Transportadora de Gas del Sur adds Argentine gas transport, liquids and midstream earnings. Its growth depends on regional energy development, infrastructure use and local policy, creating a different opportunity from US technology. Retaining it preserves that regional growth driver; the position is sized as a risky equity opportunity, not treated as a low-risk regulated utility.
What can go wrong: Argentina’s currency, regulation and political conditions can dominate results. Liquids exposure and commodity prices add cyclicality alongside infrastructure revenues.
TKO
3%
TKO Group Holdings, Inc.
Scarce live sports and entertainment.
TKO owns scarce live-sports audiences and media rights, linking growth to fan engagement, distribution contracts and monetisation of human entertainment. Those economics provide a distinct route to growth alongside industrial, financial and technology businesses. Its appeal is the durability and pricing power of valuable sports properties, with execution determining how much of that value reaches shareholders.
What can go wrong: Rights renewals, regulation, integration and costs can disappoint. Pre-2023 price history represents WWE, not the entire present-day TKO business.
TPL
3%
Texas Pacific Land Corporation
Land, water and royalties.
Texas Pacific Land brings land royalties, water and energy-linked real-asset earnings without the same operating model as an oil producer. That asset base offers growth and scarcity value outside conventional technology. Its Bolt data-centre relationship adds an AI-related option, so the portfolio keeps the holding while counting it in the broader AI basket rather than calling it wholly unrelated.
What can go wrong: Energy activity, water demand, regulation and valuation still matter. Data-centre projects may not deliver expected value and connect the holding to AI spending.
VIRT
3%
Virtu Financial, Inc.
Earnings from market activity.
Virtu adds market-making and liquidity-provision earnings. Greater trading activity and wider opportunities can support the business during unsettled markets, creating a potential offset to businesses that prefer calm conditions. The position belongs because its revenues arise from facilitating transactions across markets, while its small size recognises that volatility does not reliably translate into profit.
What can go wrong: Technology failures, hedging mistakes, regulation and competitive spreads can damage earnings. Stress can expose operational risks instead of providing protection.
WMT
3%
Walmart Inc.
Scale in everyday spending.
Walmart anchors part of the equity sleeve in everyday consumption and the ability to serve customers trading down under financial pressure. Scale, logistics and purchasing power support that role, while membership, advertising and commerce services provide additional growth. It combines a relatively resilient demand base with compounding potential beyond simply receiving a defensive dividend.
What can go wrong: Thin retail margins, labour costs, competition and execution constrain returns. A strong business bought at a demanding valuation can still suffer a large decline.
Bonds20%+
SHY
4%
iShares 1-3 Year Treasury Bond ETF
A shorter interest-rate exposure.
SHY occupies the middle ground between Treasury bills and longer-duration bonds. It earns short Treasury returns while limiting sensitivity to large interest-rate moves, providing capital that can support rebalancing when riskier holdings fall. Its purpose is steadier purchasing capacity and a modest duration response, allowing the equity sleeve to pursue growth without every holding carrying equity-like risk.
What can go wrong: Rising yields can still reduce its market value. Inflation can erode real returns, and its limited duration gives less recession upside than IEF or TLT.
IEF
4%
iShares 7-10 Year Treasury Bond ETF
The middle of the Treasury curve.
IEF is the central nominal-bond defence against weakening growth and disinflation. Intermediate Treasuries can rise as expected interest rates fall, potentially supplying gains when business earnings weaken. It balances useful duration with smaller rate swings than TLT, so the portfolio has a graduated bond response rather than relying entirely on cash or a single long-duration position.
What can go wrong: Persistent inflation and rising yields can hurt alongside stocks. US Treasury credit quality does not remove market-price or purchasing-power risk.
TLT
4%
iShares 20+ Year Treasury Bond ETF
A stronger response to yield moves.
TLT provides the strongest nominal-duration response in the portfolio. A severe disinflationary slowdown and falling long-term yields could make this small allocation valuable when equities struggle. Its role is specific to that kind of storm; pairing it with commodities, gold and managed futures recognises that an inflation shock can produce the opposite result.
What can go wrong: Long duration creates substantial losses when yields rise. Inflation, fiscal concerns or higher term premiums can defeat the expected crisis protection.
TIP
4%
iShares TIPS Bond ETF
Inflation linkage, with real-rate risk.
TIP adds longer-horizon purchasing-power exposure through inflation-linked US Treasuries. The inflation adjustment gives a return mechanism different from nominal bonds, supporting resilience when price levels surprise. It complements the shorter STIP allocation by retaining more duration, so the two funds express different sensitivities within the same inflation-linked asset class.
What can go wrong: Higher real yields can push prices down despite inflation adjustments. Inflation-linked principal does not guarantee a positive short-term total return.
STIP
4%
iShares 0-5 Year TIPS Bond ETF
Shorter inflation-linked duration.
STIP keeps inflation-linked exposure closer to the short end of the maturity spectrum. Its lower duration makes it a more restrained way to respond to inflation than relying on TIP alone. Together with bills and SHY, it helps preserve useful rebalancing capital while adding a purchasing-power mechanism that ordinary cash does not provide.
What can go wrong: Real-rate increases can still cause losses. Inflation adjustments arrive with a lag, and short maturities limit upside when long-term real yields fall.
Gold8%+
GLDM
4%
SPDR Gold MiniShares Trust
Gold without corporate earnings risk.
GLDM supplies 4% physical-gold exposure to monetary confidence, real rates and investor demand, without relying on corporate earnings. Its stated annual expense ratio is 0.10%. Together with IAU, it forms an 8% bullion allocation. The two vehicles respect the instrument-size rule while serving the same underlying role.
What can go wrong: Gold generates no operating cash flow and can fall as real rates or the dollar rise. Spreads, fees and taxes reduce net returns.
IAU
4%
iShares Gold Trust
One gold exposure, two vehicles.
IAU completes the 8% physical-gold allocation alongside GLDM. Two 4% vehicles respect the position-size rule while expressing one underlying bullion view; they do not create two independent return streams. Assess their combined exposure together and separately from DRDGOLD, whose earnings also depend on recovery costs and operations.
What can go wrong: The two gold funds share essentially the same price risk. The 5% instrument cap does not cap the combined gold exposure at 5%.
Commodity futures7%+
DBC
4%
Invesco DB Commodity Index Tracking Fund
Broad commodity price cycles.
DBC provides broad commodity exposure to supply shortages, resource demand and inflation surprises. Those forces can support returns when rising input costs pressure company margins and bond valuations. It is the core commodity-futures allocation. Its mix spans energy, metals and agriculture; returns also depend on futures pricing and collateral income.
What can go wrong: Futures roll yields, collateral returns and demand shocks affect performance. Its commodity basket overlaps with DBA; it can fall during a recession.
DBA
3%
Invesco DB Agriculture Fund
Agriculture and supply conditions.
DBA adds agriculture, where weather, harvests, inventories and food policy can dominate prices. That supply cycle differs from industrial investment and AI capital expenditure, justifying a separate 3% sleeve beside broad commodities. The aim is another source of total return and inflation sensitivity; the essential nature of food does not make agricultural futures returns stable.
What can go wrong: Good harvests, changing inventories and futures roll costs can produce sustained losses. Some agricultural exposure is already present in DBC.
Managed futures7%+
KMLM
3%
KFA Mount Lucas Managed Futures Index Strategy ETF
Follow trends in either direction.
KMLM allocates 3% to systematic long and short positions in commodity, currency and bond futures, with no equity futures. It adds an adaptive return process rather than another long-only market exposure. Alongside FMF it forms a 7% managed-futures group: persistent trends can help, while sharp reversals can erode returns.
What can go wrong: FMF and KMLM remain related strategies: weekly correlation was about 0.68 in 2021–2025. Whipsaw and fees matter; KMLM has no live 2008 or March 2020 record.
FMF
4%
First Trust Managed Futures Strategy Fund
An active managed-futures process.
FMF brings an active managed-futures process that can change direction across markets. Its task is to seek returns from sustained trends rather than depend solely on rising company profits or asset prices. Holding it alongside KMLM diversifies implementation, while the two funds must still be monitored as one related strategy group.
What can go wrong: Rapid reversals and sideways markets can cause losses. Changing positions can include equity futures; neither trend fund behaves like an immediate crash-protection contract.
Treasury bills4%+
BIL
4%
SPDR Bloomberg 1-3 Month T-Bill ETF
A short-duration capital reserve.
BIL is the portfolio’s short-duration reserve: Treasury-bill returns with limited price sensitivity and capital available for rebalancing. That practical role helps the investor maintain the rest of the allocation through stress and reduces the need to sell growth assets at depressed prices. It is intentionally modest at 4%, preserving the wider objective of long-term compounding.
What can go wrong: Reinvestment yields fall when short rates decline, while inflation can erode purchasing power. USD stability does not guarantee stability in another spending currency.
Technology, semiconductors and AI
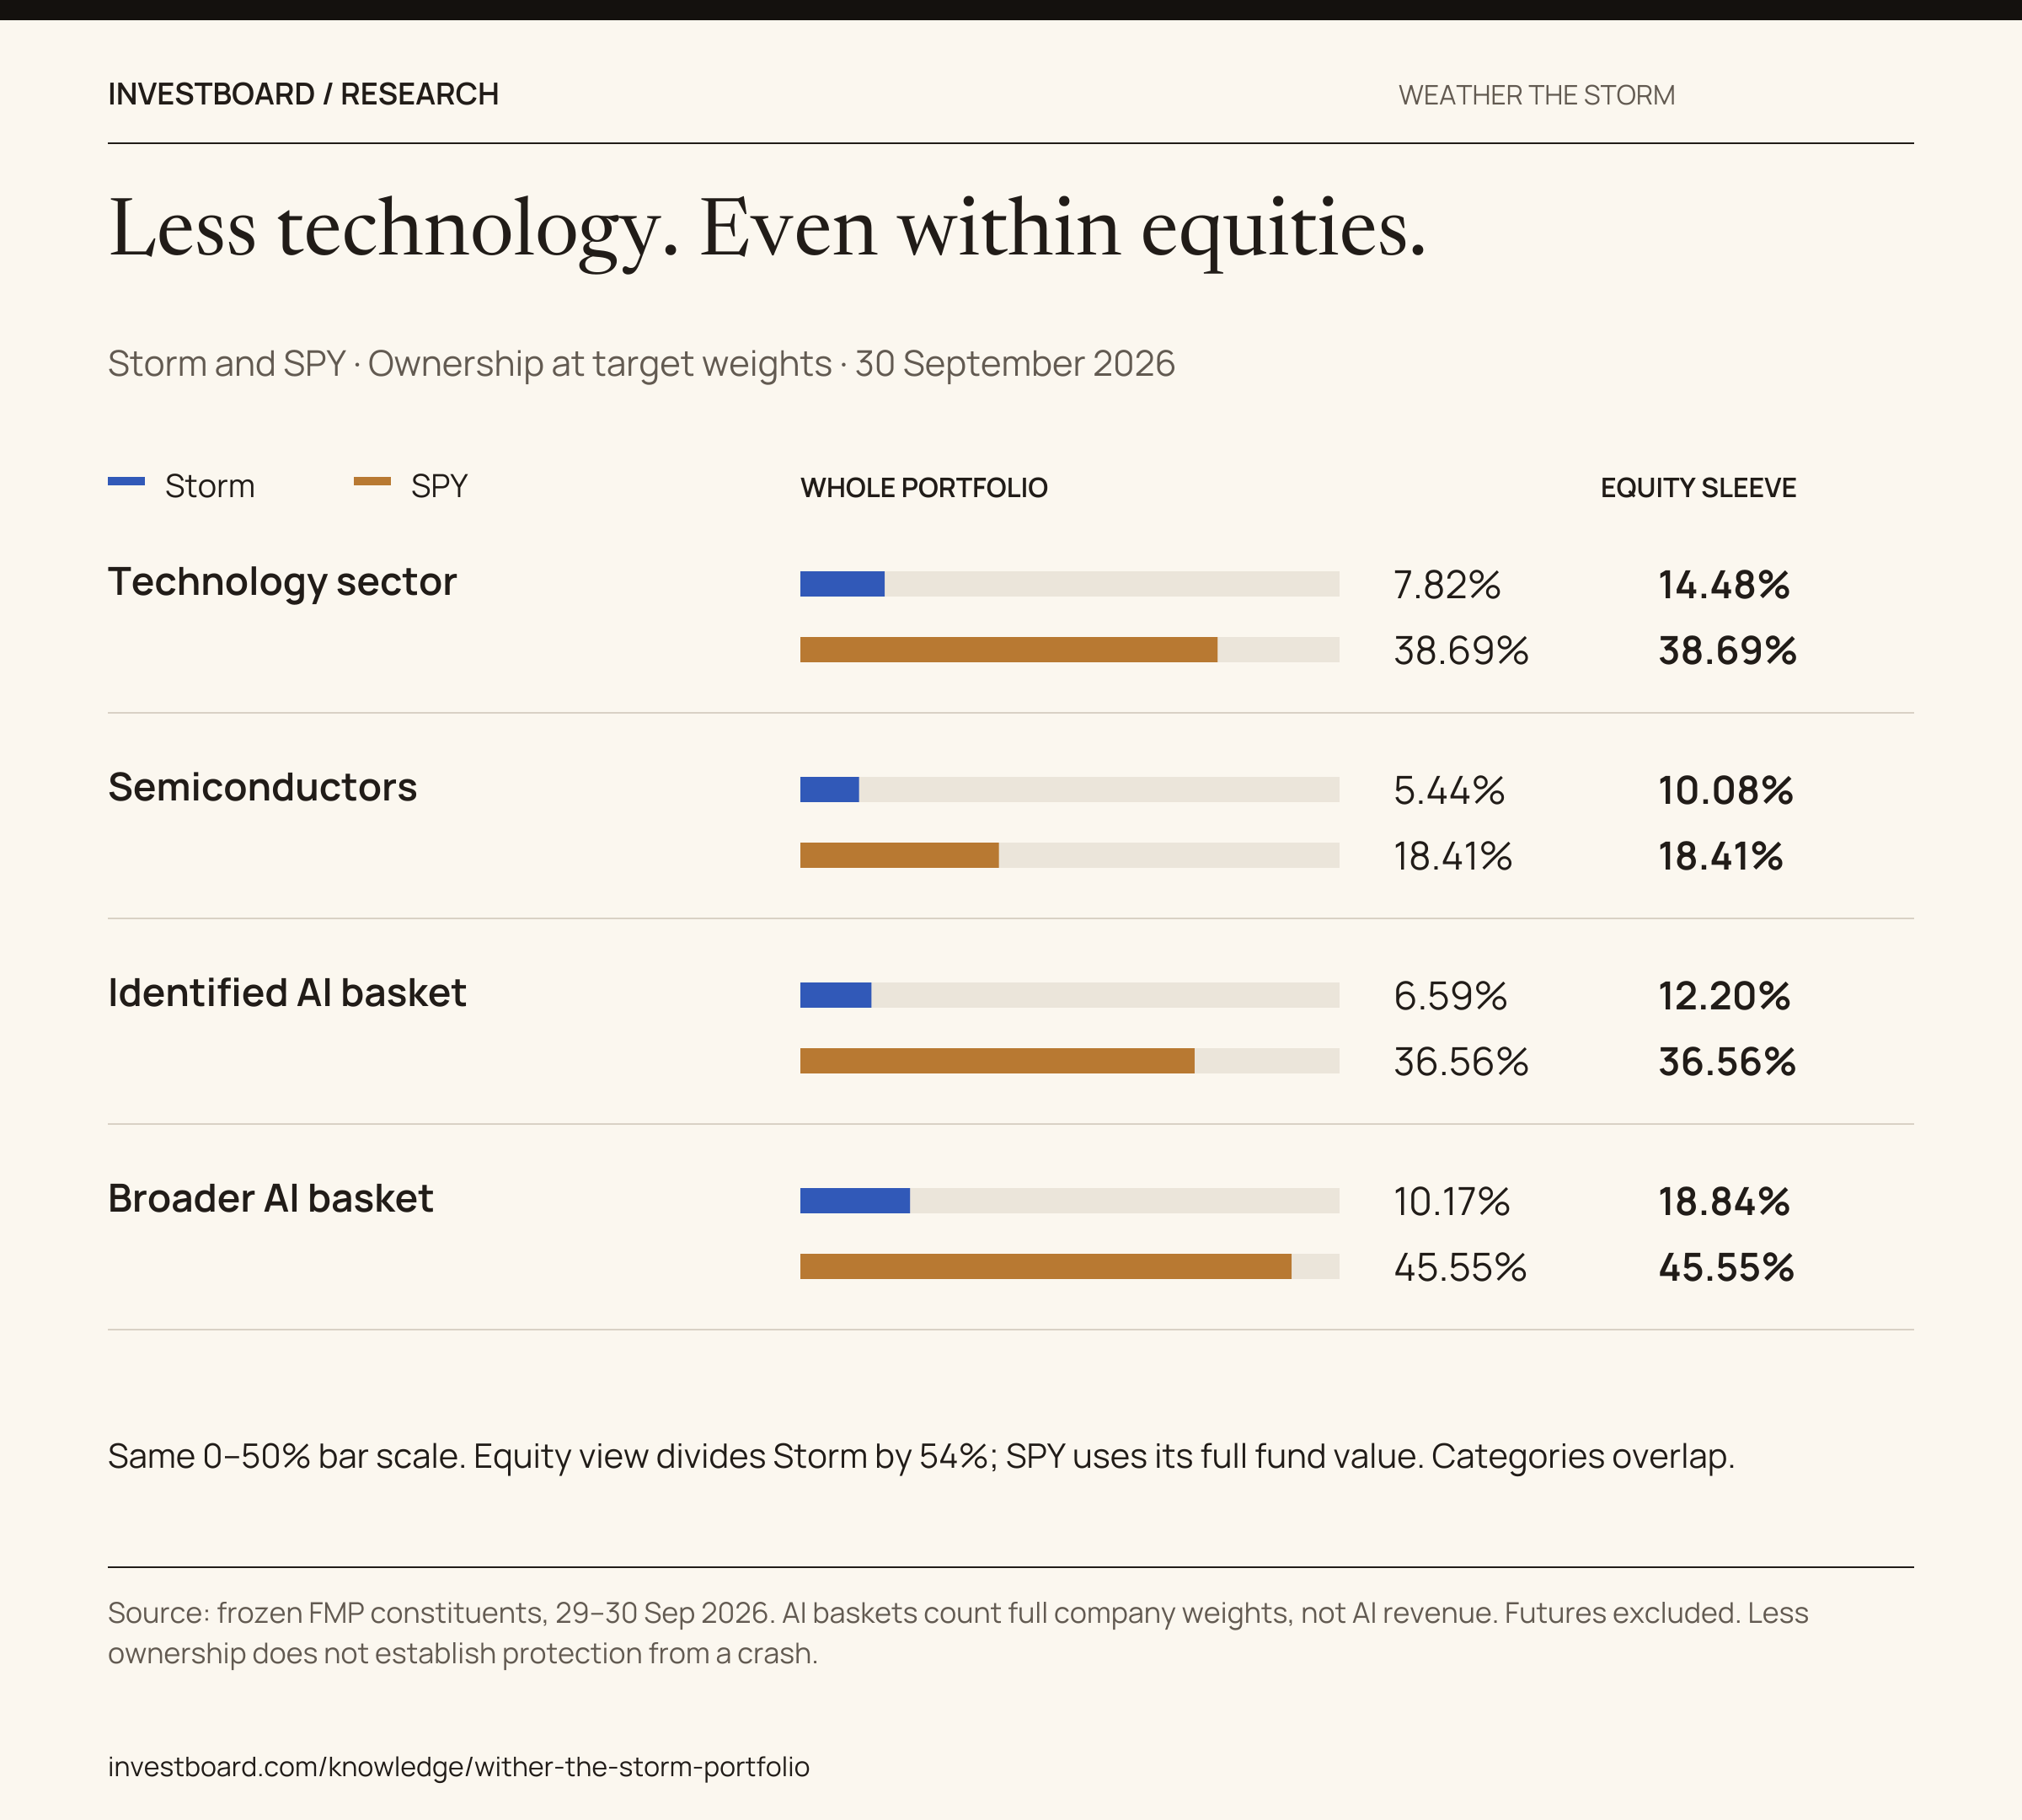
The individual ticker list understates technology exposure. NVIDIA appears directly and inside funds, while some AI-related businesses sit outside the formal technology sector. Looking through the five equity ETFs gives the following snapshot at target weights, using FMP constituents updated September 29–30, 2026.
Storm / SPY · 30.09.2026
A smaller technology share. Even within equities.
Compare the same four lenses, using the same September 30, 2026 snapshot. Storm allocates 54% to equities; SPY is the equity benchmark.
Technology sector
Storm
7.82%
SPY
38.69%
Semiconductors
Storm
5.44%
SPY
18.41%
Identified AI basket
Storm
6.59%
SPY
36.56%
Broader AI basket
Storm
10.17%
SPY
45.55%
Percentage of the selected portfolio. Both series use the same scale.
Source: frozen FMP constituents, September 29–30, 2026, at target weights. Equity view divides Storm by 54%; SPY uses its full fund value, including any cash. No reweighting of missing holdings.
The lenses overlap. AI baskets count whole-company ownership, not AI revenue. They exclude futures and do not measure sensitivity to an AI shock.
Samsung’s full holdings would increase Storm’s semiconductor estimate from 5.44% to 5.53% of total capital. The primary comparison uses the narrower definition consistently.
Both views show a smaller technology allocation. Those weights describe what the portfolios own; they cannot tell us how either would behave in an AI-led crash.
Technology follows the sector classification. Semiconductors include identified chipmakers and equipment companies. The four lenses overlap and must not be added together. Open the exhibit’s definitions to inspect the AI basket membership.
Combining NVIDIA’s direct position with its fund holdings makes it about 64% of Storm’s identified semiconductor weight. Including the full Samsung Electronics positions, classified separately by FMP, would raise the portfolio’s semiconductor estimate to approximately 5.53%.
NVIDIA is held directly and through SPY and QQQ. September 30 research snapshot; USD 100,000 of synthetic reference capital. Each fund route rounds to 0.3% here; the unrounded combined weight is 3.5021%.
Texas Pacific Land is a less obvious connection. Its approximately 3% position has a data-center development link through the Bolt agreement. Its existing economics remain tied largely to land, water and energy, so we include the whole holding only in the broader AI interpretation.
These ownership totals are a dated snapshot at target weights. They exclude changing futures exposure in FMF and KMLM.
The portfolio and the S&P 500
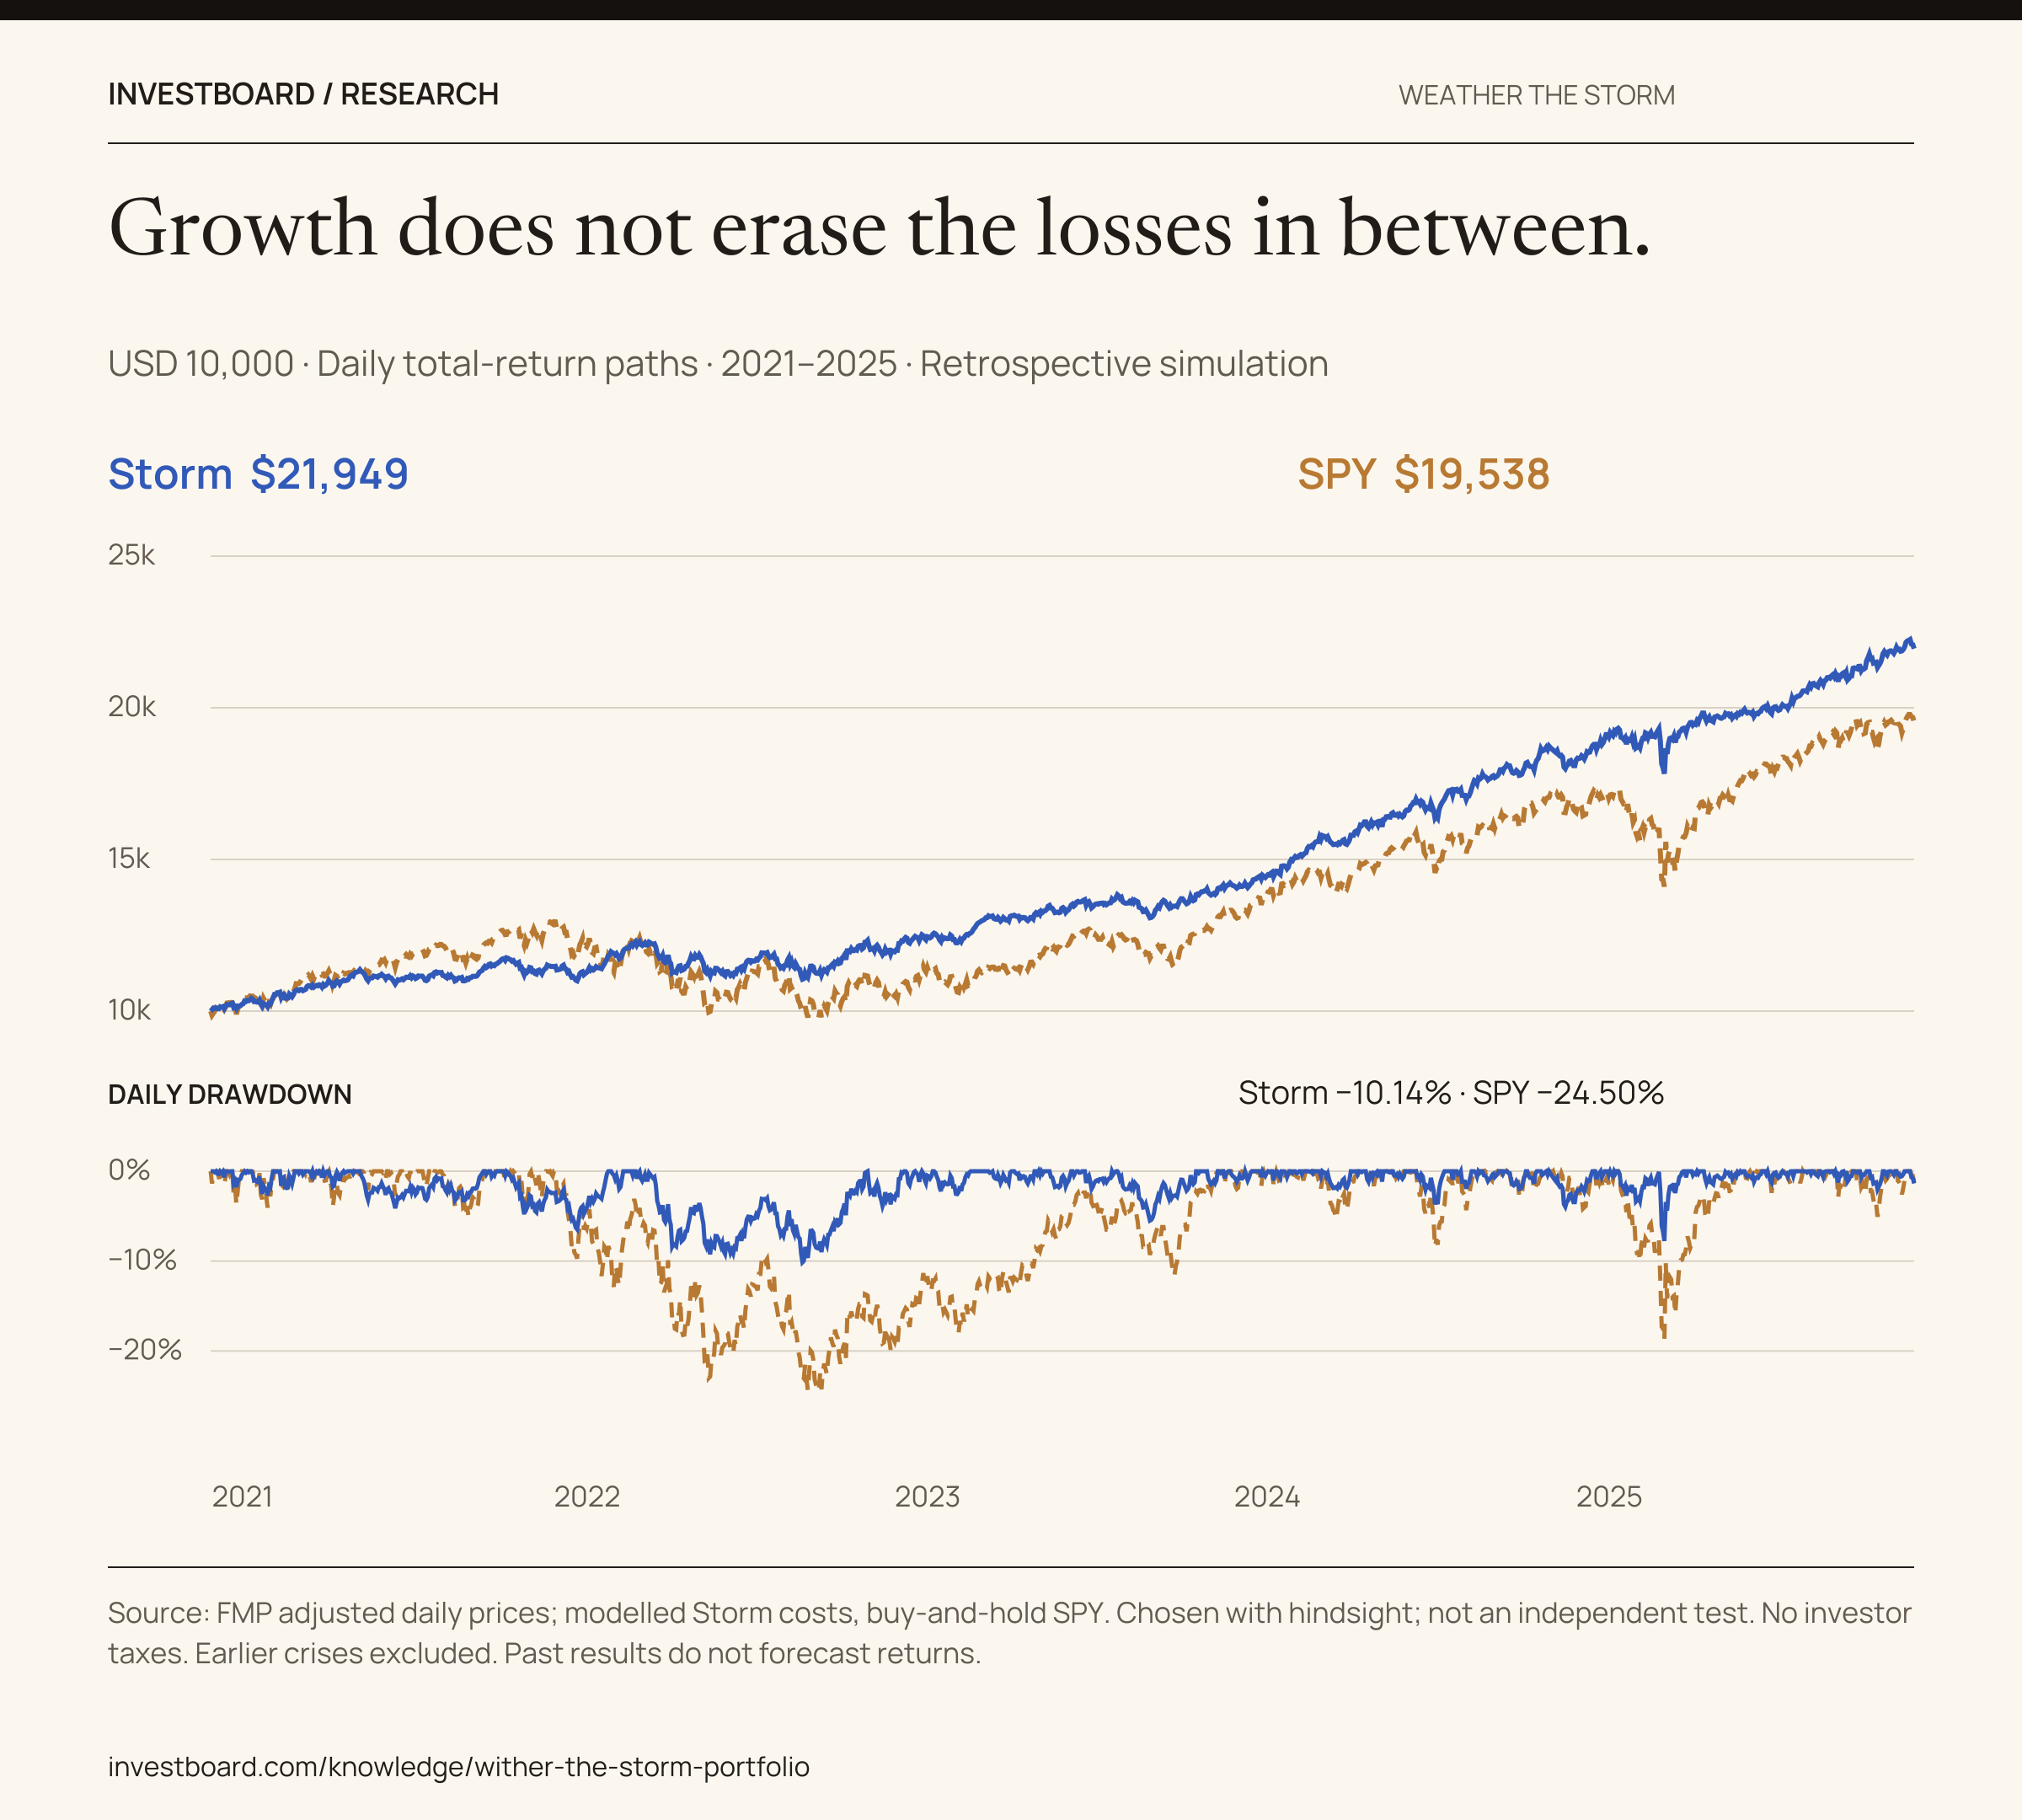
The portfolio is tested from the December 31, 2020 close through December 31, 2025. KMLM launched in December 2020, so extending this exact fund mix into earlier crises would require a proxy. This comparison uses actual dividend-adjusted fund histories in USD, with distributions reinvested. The portfolio includes modeled trading costs; the benchmark is buy-and-hold SPY.
A stronger backtest. Still a 10.14% loss from the peak.
Deepest daily drawdown: Storm −10.14%; SPY −24.50%. Both portfolios can lose money. These results reflect hindsight.
Source: FMP dividend-adjusted prices, prices through September 29, 2026; GLDM history retrieved October 8. Portfolio returns include modeled trading costs. SPY is a buy-and-hold total-return proxy for the S&P 500, not the price index. The portfolio was selected with hindsight over the period shown. Both charts use daily closes; the deepest losses occurred between year-ends. Read the annual returns table.
2021–2025 measure
Weather the Storm
S&P 500 proxy (SPY)
Annualized return
17.03%
14.34%
Total return
119.49%
95.38%
Ending value of $10,000
$21,949
$19,538
Annualized daily volatility
9.52%
17.12%
Maximum daily drawdown
−10.14%
−24.50%
Storm’s five-year backtest combined a higher return with a smaller maximum drawdown. The annual table shows how that result varied: SPY led in 2021 and 2023; Storm led in 2022, 2024 and 2025.
Calendar year
Weather the Storm
S&P 500 proxy (SPY)
2021
14.74%
28.73%
2022
4.37%
−18.18%
2023
18.10%
26.18%
2024
27.90%
24.88%
2025
21.33%
17.72%
All five Storm calendar years ended positive, despite the 10.14% daily drawdown shown above. From January 1 to September 29, 2026, the model returned 9.99%, versus SPY’s 12.94%; both precede the publication decision.
How to read the backtest
The selection shapes the result.
The holdings were selected with knowledge of historical results. Selection and evaluation involve hindsight, and the use of surviving listings adds survivorship bias. This is not an independent test of future performance.
The complete fund mix is compared over 2021–2025. It excludes the 2000–2002, 2008 and March 2020 crises. The partial 2026 result also reflects current-universe selection and earlier research using 2026 observations; it is not an independent forward test.
Different return drivers did not remove equity-market exposure: the simulated daily correlation with SPY was approximately 0.79.
Selection and historical coverage
The original 2016–2025 search evaluated 2,398 full daily portfolio simulations from a current universe of 1,269 eligible US-listed stocks and ADRs. Selecting and evaluating on the same decade introduces selection bias as well as hindsight.
The complete fund mix uses actual dividend-adjusted histories from the December 31, 2020 close through December 31, 2025. KMLM launched in December 2020. The original ten-year risk constraints cannot be certified for funds that did not yet exist; this comparison does not invent earlier fund histories.
Trading, costs and exclusions
Prices come from FMP’s dividend-adjusted end-of-day series. The model deducts 0.10% for each dollar bought or sold, excludes initial entry costs and assumes fractional positions and closing-price execution.
Cap trades execute at the same close that reveals the breach; next-session execution is untested. Fund expenses are reflected in market prices. Investor taxes, withholding and currency hedges are excluded. SPY is a buy-and-hold total-return reference.
Two different correlation measures
The target-weighted mean absolute pairwise correlation of weekly holding returns was approximately 0.18 in 2021–2025. The simulated daily correlation of the combined portfolio with SPY was approximately 0.79.
The weekly statistic averages relationships between distinct holdings. The daily statistic measures the whole portfolio against the equity benchmark. A low average relationship between holdings does not establish independence from the market.
Company histories and product examples
TKO’s pre-September-2023 series represents predecessor WWE; Texas Pacific Land’s pre-2021 history includes its trust structure. Historical prices do not represent today’s businesses throughout the full period.
The product examples use the synthetic Storm account and the report’s frozen inputs. The October 9 allocation artwork preserves the original app fonts, colors and values on a flat print backdrop. The desktop detail crops to the allocation bar and cards; the mobile image stacks the same six cards at a readable size. The complete original panel is linked beside the exhibit. The ownership register and original saved note use Investboard’s shared app components. The decision summary quotes the saved decision, preparation step and review trigger. The examples cannot alter an account or execute trades.
The exposures that deserve attention
Economic drivers / Qualitative sensitivity map
A different driver. A different failure mode.
A different driver. A different failure mode.
Condition
What may help
What can go wrong
Weaker growth
What may helpFalling yields may support nominal Treasuries.
What can go wrongInflation or rising real yields can offset that support.
Supply inflation
What may helpCommodity futures may respond to scarcity.
What can go wrongDemand shocks and futures roll effects change returns.
Market uncertainty
What may helpGold can diversify some market exposures.
What can go wrongReal rates, the US dollar and investor flows still matter.
Persistent trends
What may helpManaged futures can change long and short exposure.
What can go wrongWhipsaw, model design and execution can reduce returns.
Portfolio drift
What may helpTreasury bills preserve a short-duration reserve.
What can go wrongInflation erodes purchasing power; reinvestment yields change.
Source: report, exhibit 2. Qualitative descriptions, not forecasts or measured risk contributions. The cause of a shock matters as much as the asset label.
The two physical-gold vehicles form one 8% economic exposure. DRDGOLD adds another 3% in gold-related equities with operating risk. Broad commodities still overlap with the agriculture sleeve. Looking through the instruments reveals those shared drivers.
A shock to inflation and discount rates can hurt both stocks and bonds at once. Long Treasuries remain sensitive to rising yields, and inflation-linked bonds still carry real-rate risk.
The portfolio is USD-based. For an investor whose spending is in euros, unhedged currency movements can dominate a supposedly defensive sleeve. Broker access, product structure, fund documentation and local tax treatment also matter. Implementation depends on the investor’s jurisdiction and access to these US-listed instruments.
An AI crash can also become a recession, a funding shock or an inflation problem. Nominal bonds, commodities and trend strategies respond differently to those paths. Lower direct AI ownership helps limit one dependency; it does not guarantee a positive return in every crash.
Capital weights and risk contributions differ. A volatile 3% stock can contribute more risk than a 4% Treasury-bill position, which is why the allocation should be read alongside its company, currency and interest-rate exposures.
From allocation to a recorded decision
Investboard keeps the decision beside its evidence. This saved note states what to do, what would prompt an earlier review and when the next check is due. The 5% closing-weight cap applies to individual instruments, including funds, rather than the combined NVIDIA exposure.
Inside Investboard / Decision record
Saved decision · October 8, 2026
Retain the allocation.
Refresh stale prices before any trade.
Review sooner if
A refreshed closing price puts any instrument above 5%, or the business case for a holding no longer stands.
Next scheduled review
+Read the original saved note
Saved decision · October 8, 2026
Storm research demo, 8 October 2026. All six asset groups match their targets. NVIDIA is 3% directly and about 3.5% through all routes. Decision: retain the allocation. Refresh stale prices before any trade. The 5% closing-weight cap applies to instruments, not the combined issuer. Next scheduled review: quarter-end.
Summary of the decision saved in the synthetic Storm account. The original note is available in full above.
The complete portfolio report
The complete report explains all thirty positions: their weights, economic roles, overlapping exposures and failure cases. It also includes the rebalancing rules and full research methodology.
Use that level of detail to question a portfolio’s construction. A written investment mandate can connect the allocation to loss tolerance, liquidity needs and review conditions before market stress forces a decision.
Take the evidence with you
Three standalone exhibits, each with its dates, definitions and limitations.
Download the English PDF with target weights, the rationale and trade-offs for every position, annual results and the complete methodology. The complete 28-page report is free to download. No account required.
First public edition: October 8, 2026. Retrospective portfolio research.
First public edition: October 8, 2026. Ownership snapshot: September 30, 2026; prices through September 29. Educational portfolio research; historical results reflect the selection process and assumptions above.
Common questions
How much technology, semiconductor and AI exposure does it have?
At target weights, technology represents 7.82% of the whole portfolio, semiconductors 5.44%, the identified AI basket 6.59%, and the broader AI basket 10.17%. These categories overlap. AI measures whole-company ownership within defined baskets, using September 29–30, 2026 constituents.
How was the historical performance calculated?
The simulation uses FMP dividend-adjusted prices, reinvested distributions and modeled trading costs. The stock search used 2016–2025; the complete allocation is compared over 2021–2025, with hindsight and selection bias. The methodology records the assumptions and limits of this retrospective backtest.
Who can download the complete portfolio?
Anyone can download the complete 28-page report for free, without registering or signing in. English and German editions include all 30 positions, target weights, rationale, risks and methodology.